A SaaS Company’s Guide to Converting More Across All Stages of the Funnel

If you’re running a SaaS business, you’re most likely working hard to present your product in the right way and get your name across to your potential market.
In my years as an optimizer who has worked with several SaaS businesses, I have noticed a very disturbing imbalance.
Companies either invest all their efforts in building an amazing product and completely overlook the marketing side of it or they focus only on getting the leads but then leave these leads to navigate the process of loving the product and actually “winning” from it, all alone.
I could write about the metrics you can use to optimize your funnel. I could write about the “best practices” of CRO across funnel stages. But why should you read that?
This is why I have dedicated 2000+ words to bringing your business back in balance. This is a very complete, yet to the point guide that will help you acquire leads, nurture them, close them and measure your effectiveness – without wasting time, money or resources.
First – The Numbers. Define How You’ll Measure Success
Any solid conversion optimization program starts with defining the business objectives and then putting the measurement systems in place. If we’re not measuring correctly, chances are we’re not going to analyze performance correctly and we’ll focus on all the wrong things.
First things first, we need to decide what’s important for our business. What follows is a list of the top metrics to track for a SaaS business, some of the key variables that make a massive difference:
1. Visitor to sign-up rate
Why is this important? Your presentation website is the first place where any potential client will get to know your product, evaluate it and decide if it’s worth giving it a try.
Measure unique visitors here and calculate your success rate with the following formula:
Number of sign-ups / Number of unique visitors x 100
2. Sign-up to qualified lead
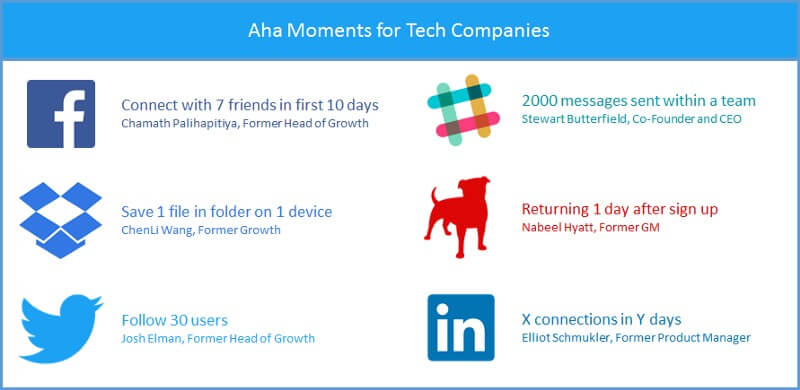
You need to ask yourself the question here and define when a lead becomes qualified for the product – what is called an AHA moment. The AHA moment is basically the moment when a user finds the benefit in using your product. It is crucial that this moment happens as soon as possible in the trial period.
Let’s say you are offering a software that does basic accounting for small companies. The AHA moment could be the moment where a user creates his first invoice.
Make sure you are tracking all the interactions a user can have with your app. For most of our clients we use a system of events that are then sent to Google Analytics and go off that.
In our example with the invoice creation, make sure you have a separate event for the #first-invoice than all the other invoices the user can create afterwards so to have a number that is as accurate as possible.
Calculate this with the following formula:
Number of events / Number of trial users x 100
3. Qualified lead to customer
After your trial users have had their share of AHA moments and have tested out your app sufficiently, you want them to become paying customers and take full advantage of all the features your software has to offer.
This is a pretty straightforward calculation, with two main elements: the number of users that select a pricing plan and put in their payment information and the number of qualified leads you got.
Number of payment confirmation / Number of Qualified Lead x 100
4. Customer Churn Rate
The customer churn rate can be seen as the rate at which a business is losing customers due to cancellation of their subscriptions. It can happen proactively or passively – proactive is when they willfully cancel and passive is when they fail to renew their subscriptions.
Many articles and pieces have been written on this subject and it is too complex to properly do it here but I will say that the easiest, high level formula is:
Number of lost customers / Number of total customers
Read more about Churn Rate and how to calculate it in this article.
Calculate this for a specific timeframe, taking into consideration any spikes in growth or seasonality effect.
5. Customer Lifetime Value
There are many formulas for calculating lifetime value but what’s important is what you are trying to find out and that is: the average amount of revenue a customer generates for you before they cancel their subscription.
The simplest formula I have so far to calculate this is:
ARPC (Average Revenue per Client) / Customer Churn Rate
This is only a basic formula and should be treated with caution as this does not account for other variables, such as the Monthly Recurring Revenue expansion rate.
6. Customer Acquisition Cost
The customer acquisition cost is the money you spend for each new customer you get. This includes any marketing expenses and, as a general health indicator, should be somewhere under three times less than your Customer Lifetime Value.
Calculate this by dividing your total cost of Sales and Marketing to your total number of customers acquired in that time.
Total $ spent on Sales and Marketing / # of customers acquired
Going forward, there are more metrics to consider, such as Monthly Recurring Revenue Expansion and Churn but, for the purpose of this article, we will stick to the five listed above.
Now that we have our metrics in place, I think it’s about time we analyzed each and then start identifying opportunities for growth and optimizing those conversion rates.
Second – Turn More Strangers into Leads. Optimizing the Visitor to Sign-up Rate
When you’re looking at your visitor to sign-up rate you are looking at how well you’re communicating your offer and how well you are targeting your marketing efforts.
One of the first elements that pop in your visitor’s mind and screen?
A clear and memorable Value Proposition
Your value proposition is what defines your product and makes it stand out. The value proposition should be clear and memorable, you want your visitors to understand from a quick glance what your product is offering and how it will improve their lives.
When browsing through some CRM products, we can see the headline Pipedrive use:
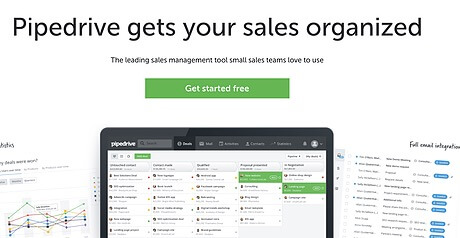
The benefit here is very straight-forward, without any unnecessary words. What do you need to do for your sales team? Get them organized. Pipedrive can help you do that.
Being Customer Centric
So many businesses say that but so few actually do that. The main idea here is making sure you clearly communicate what your business can do for its clients – state what it does and why that’s a good thing.
Find out what’s important for your clients by running customer surveys. This will help you in two ways:
- Identify the elements that convinced them to try out your product and then use it
- Assimilate their language and use it to help other potential clients relate to you and your product
You can find out a lot more on how to run and analyze customer surveys in this ConversionXL article here.
Crystal-Clear Pricing Structure
If there is one thing that I have seen repeat itself over and over again is that a confused client is a lost client. You might get their buy in, initially, but it will be short-lived. The pricing structure should, ideally, contain between 3-4 pricing tiers that are easy to understand and easy to decide on.
Oftentimes overlooked, the pricing page can draw quite a lot of traffic. When analyzing the behavior flow for some of our clients, we discovered that the pricing page was the first one they visited after the landing page, in order to see if they can afford it and what they are getting for their money.
Online users are becoming more and more skeptical when it comes to software fairytales and being transparent and to the point will make a noticeable difference in the overall performance of your marketing.
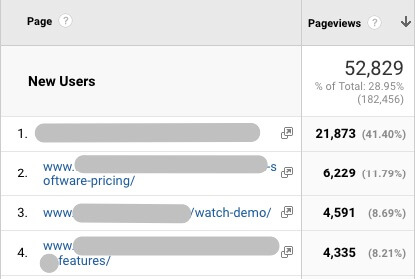
This snapshot is taken from one SaaS client and you can see how the pricing page is getting almost 12% of all pageviews from new users, followed by the sign-up page, with 8.69% and then the features page with 8.21% of all pageviews.
If they would ignore the pricing page, then it would be like they are saying they simply don’t care about 12% of their marketing spend.
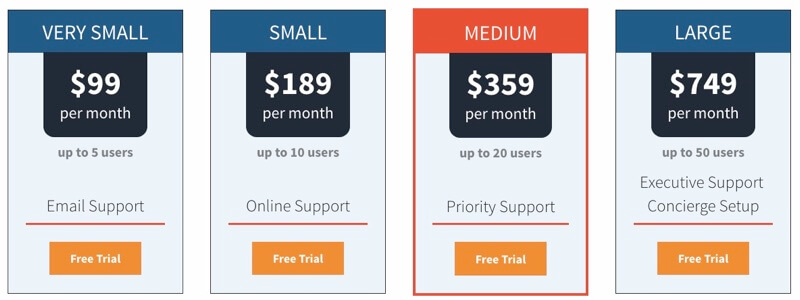
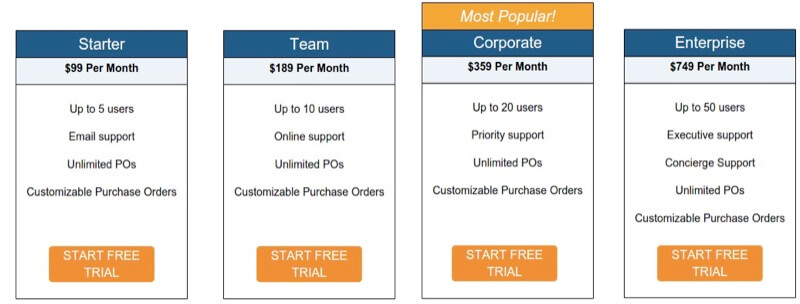
We have tested a new layout of the pricing page for another client, in which we listed all the features each tier included and, also, highlighted the most advantageous package and we saw an 81% improvement in the clickthrough rate to start a trial and a 6% increase in overall trial started. This test ran for three weeks before deciding to implement this as the new control. The version here is a very simple one but it worked.
The control had only one or two features listed and the titles were, maybe, focused a bit too much on size and made customers feel small even though they were paying almost $200 per month.
Some pricing pages I think are doing a great job at communicating their available packages?
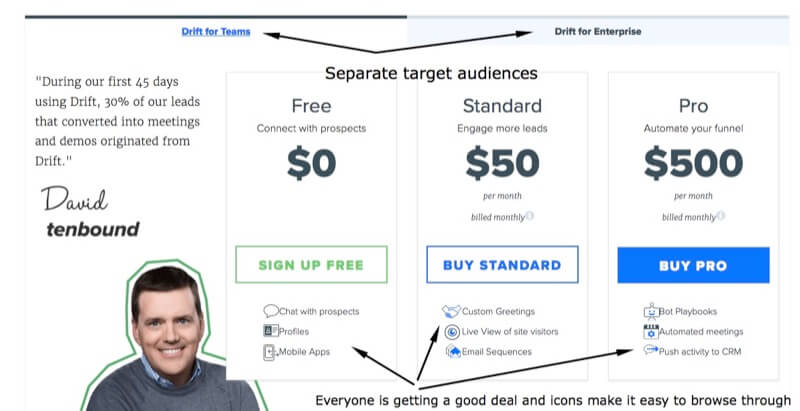
- Drift is a conversational marketing platform and their pricing structure is so easy to understand and browse through. They are separating the two target audiences so that small teams do not feel intimidated by the Enterprise packages and the Enterprises feel like they have their own special place, with the elite.
Another interesting element is the use of icons in the features list, as well as the fact that they kept a number of three features for each so that everyone feels like they are getting a good deal.
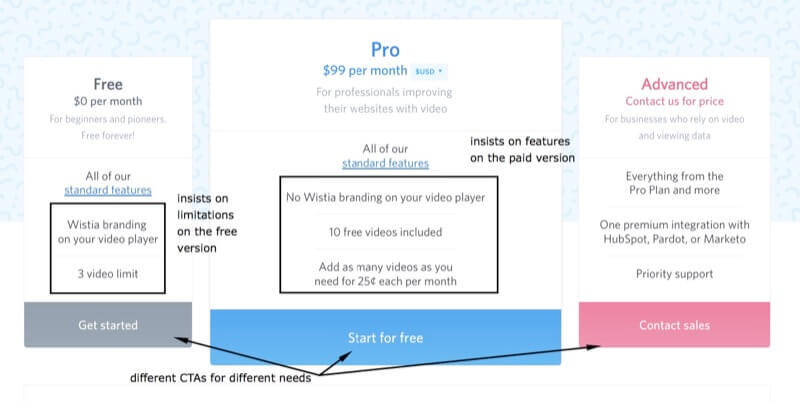
- The people at Wistia have kept it much, much simpler with a big, standout section for the middle package, or the Pro as they call it (and most SaaS websites, actually). The interesting element about this pricing layout is that they present the negative aspects of the free version and the positive aspects of the pro version so that when you compare the two, it would definitely make sense to go for the Pro and test it out. The fact that they are using different CTAs for each package also helps in keeping things separate in the users’ minds and helping them decide.
Third – Help the Leads Know That You Can Solve Their Problems. Optimizing the Lead to MQL Rate
After you’ve converted a nice part of that marketing traffic into leads, you should be focused on how you get those leads further in the funnel.
As a product manager/owner, you know your product’s value by heart and could probably talk about it for hours. For your trial users, however, the value might not be that obvious from the beginning and that’s where you need to come in and guide your user through the onboarding process.
How do you identify that AHA moment? You look for correlation in behavior patterns – does a certain action correlate with a high number of retained users and a low number of churned users? That’s probably it! It depends from case to case but with some thorough analysis and a bit of intuition, you should have no issue in finding it.
Like we mentioned in our example earlier, the AHA moment for our pretend accounting software would be when users have created their first invoice as then they would really get to experience how easy it is to use the software and how accounting is not such a daunting task after all (it kind of still is).
In the graphic below you can see examples of some other AHA moments for some major tech companies
Start with an AHA-first onboarding and you should see results coming in.
Of course it is very tempting to throw all your features at new users but keep in mind how that can be intimidating and one of the main reasons why users refused to test out a new software was their fear that they would go through a painful learning curve (own research on 60 respondents).
Guide your users through each important feature and you will see that the more they use your software, the harder it will be for them to live without it afterwards.
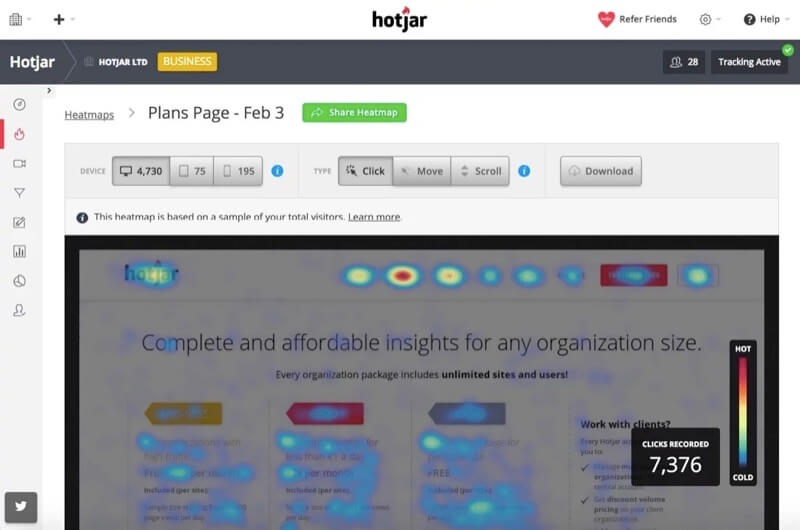
After analyzing the heatmap of a client’s initial dashboard, we noticed that users were drawn by all the many calls to actions and elements on the dashboard and many of them would overlook the invoice creation button, which would take them to that AHA moment. By removing most of those elements from the first login dashboard, we saw a significant increase in invoice creation clicks and a 16% increase in users that would pass the trial period and sign up.
You can use tools like Hotjar or Inspectlet to run the same type of heatmaps on key pages in your app and then start testing.
Fourth – Help People With a Problem Commit to Your Solution. Optimizing the MQL to Customer Rate
Now that you have most of the pieces of the puzzle in place and that your trial users reached that AHA moment, it’s really time you start talking to them and unveiling other key features.
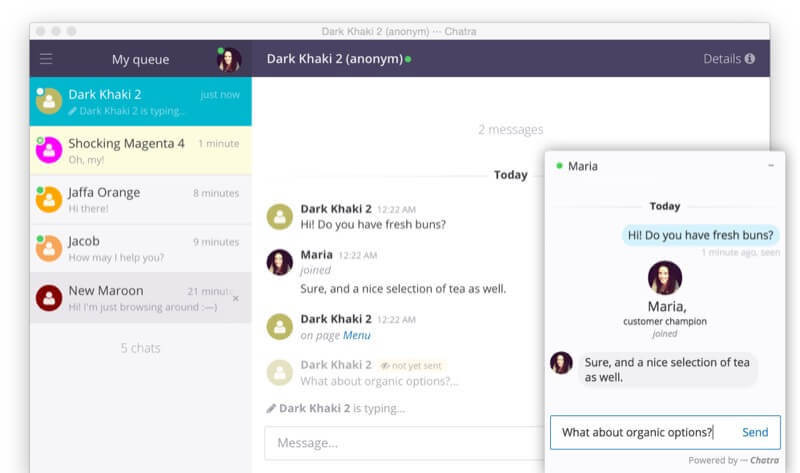
The most encountered (and, could be, the most efficient) way is through a live chat function that would uncover most of the questions users would have at this point and then address them.
Live chats can be ignored if timed incorrectly. For example, the way we try to implement this and it has shown good results so far is to leave the users focused on the software and getting acquainted to the dashboard for a bit, reach that AHA moment and then you step in. That’s the point where they’re actually interested in talking to you and they have some questions already.
Imagine every time you walk into a clothing store and a sales assistant jumps right at you saying how can they help? You don’t even know if they have the style of clothes you are looking for so you don’t really want to waste time explaining what you’re looking for before you’ve validated the store.
Fifth – Make Sure Customers Turn Into Evangelists. Reducing the Customer Churn Rate
The truth about your customer churn rate is that it is directly connected to your users’ engagement with the app. Users that find reasons to login to your app daily or every couple of days, at least, will most likely use it for a long time. The less they interact with it, the more likely they are to leave.
How do you make sure your users keep using your app? You invite them to do so! You stay present in their minds and emails and remind them every now and then of how much value they are getting out of their subscription.
One specific moment when churn occurs?
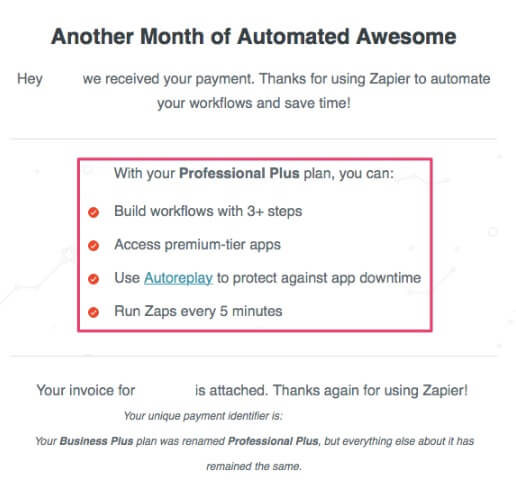
When you send an invoice! We also see that in the agency, if we’ve sent a monthly invoice but did not communicate very well on what has been done over that month and one-two places where we added value, customers are much more inclined to question the work and whether it’s worth paying it.
Zapier are doing an amazing job at this by reinforcing their benefits in the actual invoice so that you’re reminded why you should pay it and continue to do so.
If churn does occur – and it will, in many cases, make sure you see the value in it and try to talk as much as possible with those users. Get their feedback and see how you can better your onboarding and product in the future so that you can continually grow and see improvements.
The bottom line on this is that the more dimensions and customer usage you can track and the more insights you can extract out of them, the more successful you should be in your efforts.
Make sure you identify patterns in behavior and correlation between them – watch out for any false indicators of engagement or inactivity, on the other hand, and work towards the correct goals.
Your AHA moment is what determines a big part of your funnel’s success so take all the time you need to identify it and then split-test as many versions as you can until you’ve reached top performance.
You’ve seen some of the top metrics that are important for optimizing your SaaS customer acquisition funnel and have seen examples of how some companies do this right.
This information is yours to take action on.
Apply it in the way that best fits your business and make sure you always test any considerable changes and designs, no matter how much success others have had with them.