The Future is Now: Actionable Insights Directly from your Consumer’s Brain
95% of our decisions are influenced or even made by our subconsciousness.
This subconscious is the superfast, automatic part of the brain that filters and processes all that we see and experience throughout the day, without us being aware that this even happens.
Our brain automatically triggers emotions to influence rational decision making. Therefore our emotions are the basis of our behavior, online as well as offline.
That’s all fine and good…but this reality creates a big problem, a gap if you say in the current methods of user testing (like interviews, focus groups) which have no objective way to measure and map the emotional experience of the user.
Without having direct access to the emotional experience, we are only left with the manifestation (physical actions, words) manipulated by those emotions.
And the manifestation may be hugely misleading. People may not express themselves because of inhibitions. Sometimes they do not know what they are feeling and mistake one emotion for the other.
Enter Neuro-Usability
Fortunately the neuro usability method has the means to go right to the source. This method is fairly young and was introduced into the user testing market by Braingineers six years ago (www.braingineers.com).
The neuro usability method adds an extra layer of data, that is brain data to conventional usability testing results. Through the use of EEG, brain activity is measured and processed by emotion detection algorithms. With these science based algorithms the following three emotions can be analyzed while participants navigate through a website.
- Joy, a positive affect which occurs when people are exposed to positive stimuli or images, ór when they reach their goal. On a website this can be for example, a picture of a nice beach (think of Booking.com or TUI), or when you reach a goal like finding a good suitable deal.
- Attention, is a mental state, which represents high activity in cognitive processes. This often happens when processing information, like reading text in a different language, or complex information, like product details for insurances or banks. It also kicks in when someone is considering pros and cons, while making a purchase decision.
- Frustration, is a negative emotion that occurs when there are obstructions in the path towards a goal, or when people are exposed to stimuli with a negative consequence. For example, when you’re confronted with a payment after choosing a new phone for example. Frustration also occurs when expectations aren’t met. That’s why frustration is the best emotion to use in explaining dropout behavior of visitors.
How Frustration, Attention & Joy Behave Across Devices and Industries
Braingineers recently gathered all their data for 2018 and analyzed the emotion scores of all participants.
This effort has been compiled into a report that you can access here for in-depth insights.
The data is compared for different branches, devices and types of flows.
In this blog, I would like to focus on the 4 big take-aways we had from the exercise.
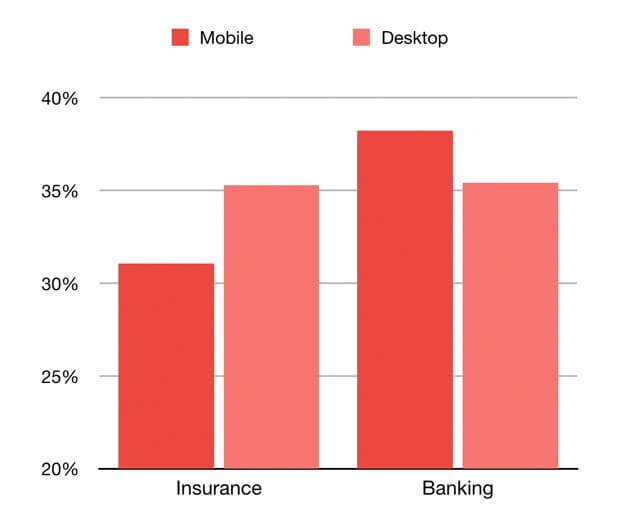
This first graph shows percentages of the average measured frustration levels on desktop (red) and mobile (light red) for the sectors of Banking & Insurance.
What stands out is that insurance websites and banking websites score similar frustration points on desktop. But on mobile there is a big difference of 22%, where insurance websites on mobile are significantly lower on frustration.
“An explanation can be that people are more used to switching insurers (sometimes once a year) than switching banks. Good insurance is offered by way more providers. That’s why insurers need to invest more in a good and fluent mobile user experience” says Braingineers.
Overall we see that insurance websites and banking websites also induce high levels of joy, possibly because of the statisfaction of having “secured” an important aspect of one’s life.
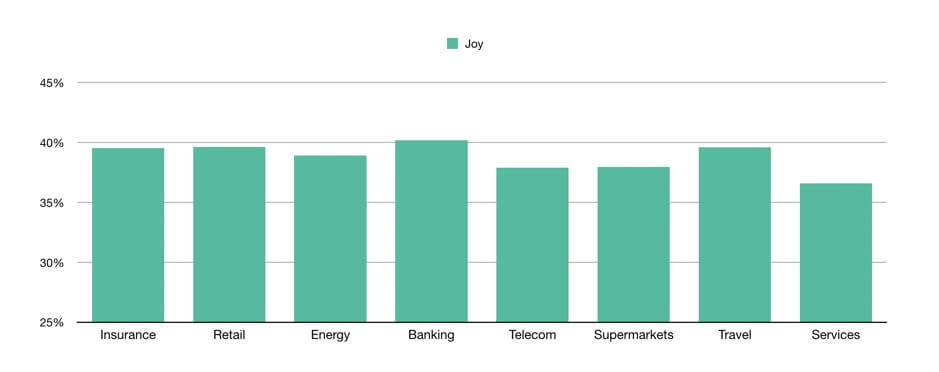
Another startling bit of insight pertains to Travel websites. We would expect to see a big spike in the joy quotient, because after all people are going on vacations.
But the relatively mediocre results are explained by Braingineers “In our experience we see that travel websites contain a lot of moments where a user has to make choices, which causes a choice-overload experience and limits the user’s positive emotions.”
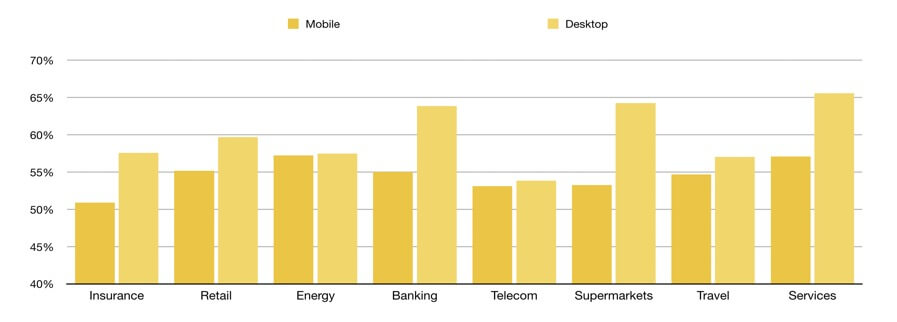
The third graph shows attention scores on desktop and mobile.
What’s striking is the difference between supermarket websites on desktop (light yellow) and mobile (dark yellow). Desktop demands significantly more processing. This difference can be explained by the increased levels of distraction and extra content presented on desktop causing the user to focus harder to stick to the “grocery list”. We see, for example, a lot of recipes, offers, brand promises, BBQ-tips and more.
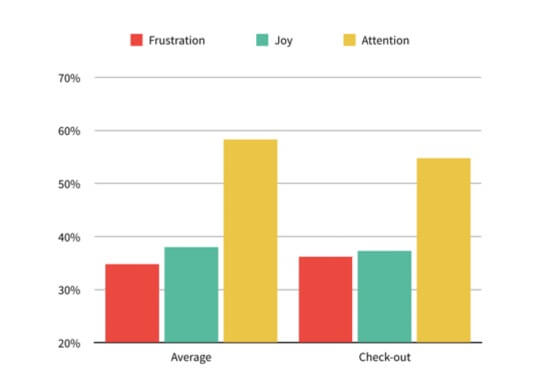
Graph 4 shows how the check-out pages from all tests score on the different emotions of Joy, Frustration & Attention. While most workflows on an average score high on the factor of Attention, we see that Frustration is higher for checkouts than for other experiences.
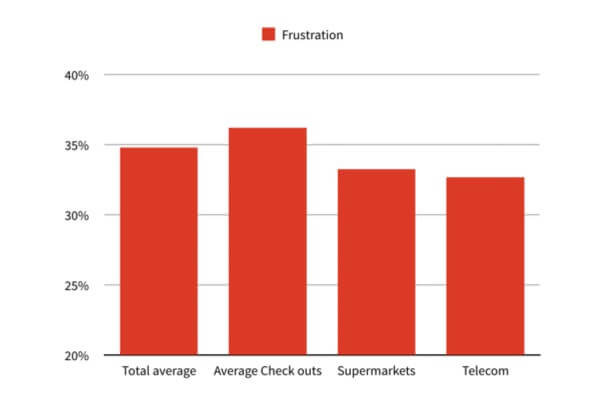
Digging deeper into Frustration, 4.1 shows that Telecom has the lowest frustration score for checkout pages, which shows maybe they are leading the way to creating a frictionless checkout.
TAKE-AWAYS YOU CAN USE:
- What is the standard for your industry and sector? Which emotion dominates the scale? If it is attention, maybe it is time to scrutinze your website and see which areas are requiring higher than usual effort to navigate and then launch optimization drives to make them better.
- Do you have a checkout process? Try to ensure that the benefit of using the product (gratification) wins out over Attention and Frustration. This is an area of weakness in most sectors and brands that can help you gain a competitive edge.
The focus on emotions in user experience is growing day by day and companies are willing to invest in improving their customers’ emotional experience.
The first step is to make emotional responses measurable and innovate based on the results. The Netherlands seem to be leading in in this field since a large percentage of the top companies prioritize optimization for emotional experience.
Where are you?